I have added/rearranged this post as new updated ethnicity estimates have become available.
When we were growing up we were told that we were “Scotch, Irish & German.” It is difficult, however, to trace back from where all my mom’s ancestors immigrated. Many were some of the first immigrants to the New World in New Netherland (New York & New Jersey) and Virginia. I have reached dead ends in some lines.
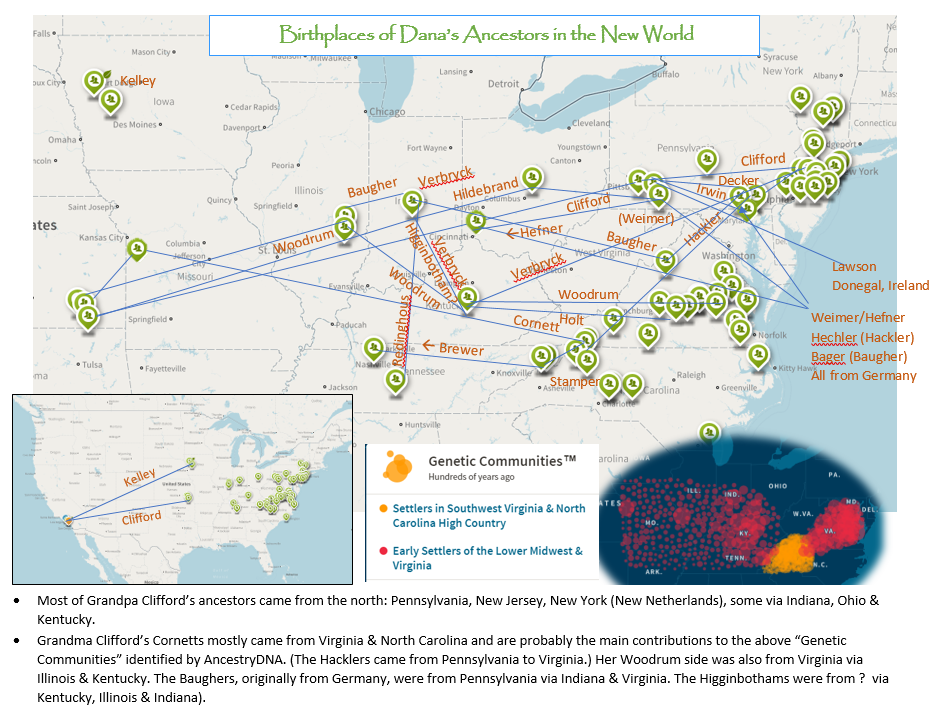
Here is a map of how many of my ancestors migrated across America, mostly on my mom’s side. (My dad’s family settled in Iowa and then moved to California where I was born.):
To begin, it helps to have some understanding of genetics. Although we are guaranteed to get 1/2 of our genes from our fathers and 1/2 from our mothers (actually a little more from our mothers, if you include the little extra on the X chromosome for males and mitochondrial DNA). We are likely to get 1/4 from each of our grandparents, but that can vary depending on which genes were contributed to us by our parents. So the estimated percentages, that I came up with from my tree were based on an 1/8 from great-grandparents, 1/16 from 2nd great-grandparents, 1/32 from 3rd great-grandparents, etc….
Here is an estimate for my mom based on the family tree (I mostly used Mom’s 3rd great grandparents as a basis.)
- English: 41% (Most of the Cornett, Stamper, Woodrum sides, many were early settlers in Virgina [may include some Irish & French]; also the Cliffords in New Jersey & Pennsylvania.)
- German (Click on Link to see some short biographies) 25% (The Hildebrand side (PA) [includes some Alsatian]; The Hackler/Hechler side (PA & VA) [includes some Alsatian and Swiss]; and Baugher/Bager (PA, VA, IN) side.)
- German and/or English? 3-6% (The Holt side KY, VA, NC plus unknown maiden name for Mary Holt??)
- Dutch 8% (The Verbryck (NJ) side and the Decker (NJ & PA) side were descended from early settlers in New Netherland, although they were mostly Dutch, it included settlers from Belgium, France, Germany, Schleswig-Holstein, East Friesland, Spain, Norway, & England.)
- ?? unknown maiden name for Isabella Decker–3%
- Irish/Manx? 6% (The Lawson (PA)–might really be McLaren; see the Lawson/McLaren surname entry here.) Maiden name of Sarah Lawson: Fleming means from Flanders, the northern Dutch-speaking region of Belgium.)
- Scottish 6% possibly? (from surnames Gordon [NJ & PA, VA?]; and Scott [NC])
- Scotch-Irish 5% (Irwin [PA], new information has the Irwins descending from Ulster Scots; McGatta possibly comes from there, too.)
Following are new ethnicity estimates from AncestryDNA, which appear much more accurate:
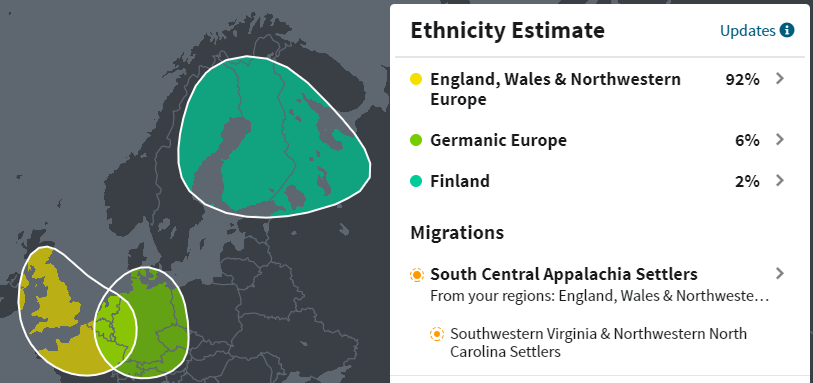
Here is the new estimate from AncestryDNA for my mom, Doretta Clifford Kelley:
Versus her old estimate:
 She appears to have lost all her Irish! –And many of those odd trace ethnicities. She went to having just a trace Great Britain to 92% England, Wales, Northwestern Europe. I would have expected more German and Irish. But remember that there have been lots of migrations in Europe and many of the people of England are really French, German and Scandinavian as well as Celtic. People have been interbreeding for millennia.
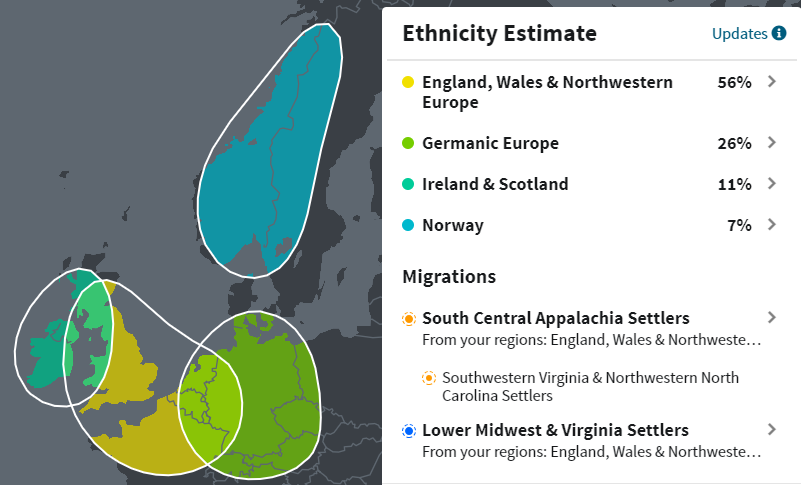
Dana Kelley Bressette’s New Estimate:
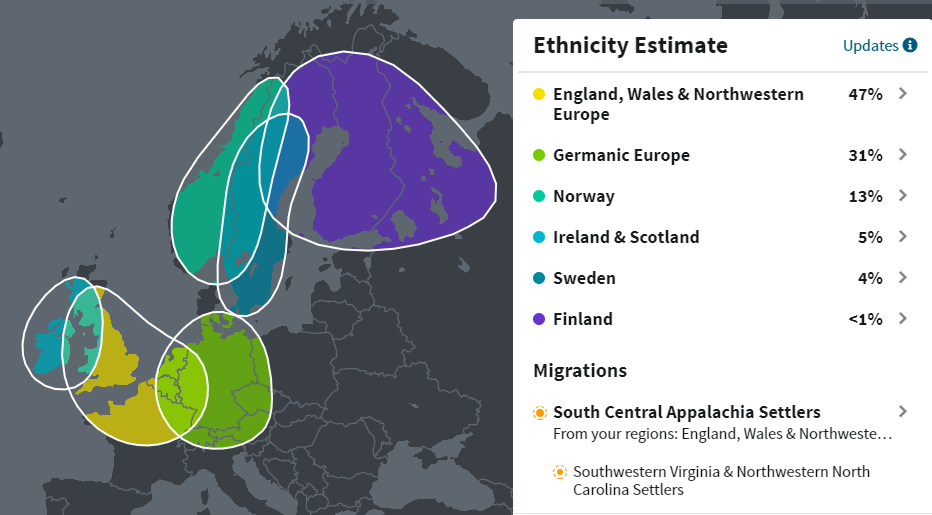
Eric Kelley’s New Estimate:
Bruce Kelley’s New Estimate:
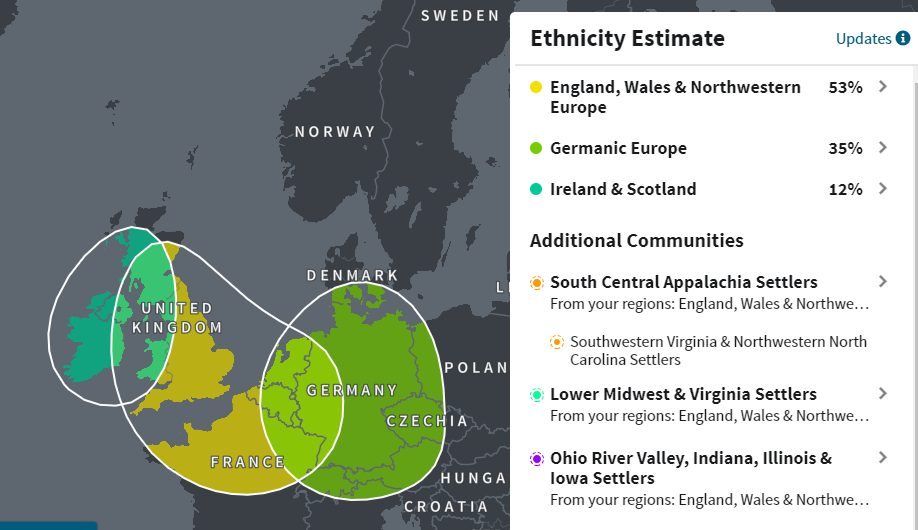
Eric appears to have gotten some Swedish and a trace of Finnish and has more Norwegian than me. Bruce did not show any Scandinavian. Bruce and I ended up with more Irish; and I got a little more English and less German than Bruce and Eric. Otherwise, we are all now more similar. Eric’s changed significantly from his previous estimate. He went from having 78% British to 47% England, etc. (which did not make sense, since mom’s previous estimate had her as < 1%!) You can see the older estimates if you scroll down to older ethnicity analyses that I had done.
If I average mine, Eric’s and Bruce’s together, I get the following estimate for my dad, Dean Kelley:
- Germanic Europe: 55 %
- Norway: 13%
- Sweden: 3 %
- ——- = 71% added together
- England, Wales, Northwestern Europe: 12%
- Ireland & Scotland: 19%
- ——- = 31% added together
(There is an extra 2% because the math showed a -2% Finnish)
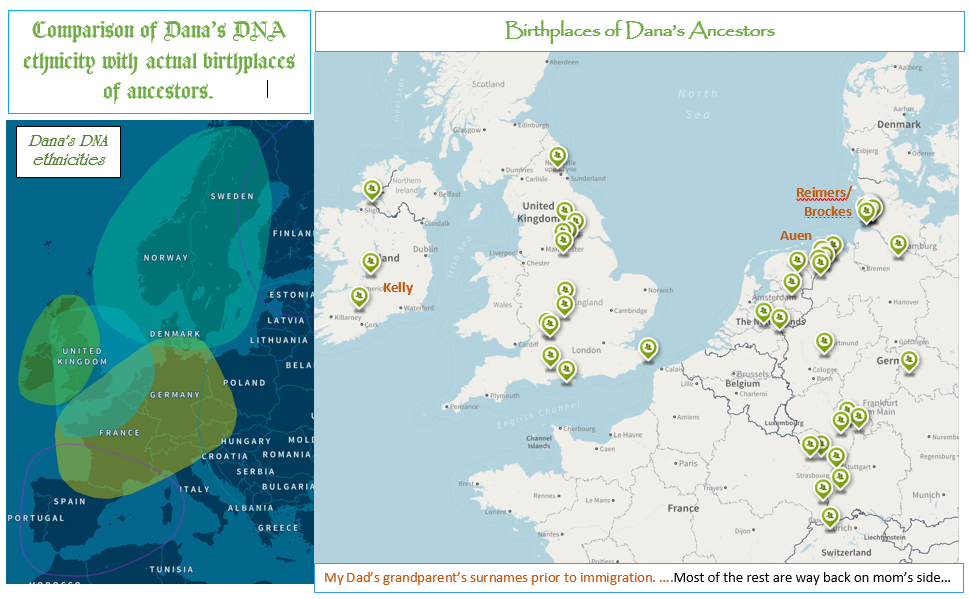
We know that all 4 of my dad’s grandparents emigrated from Europe so what we might expect would be:
- Northern Germany/Denmark: 50% (Claus Reimers & Marie Brocksen from Schleswig-Holstein)
- East Friesland: 25% (Ida Auen)
- ——
- Ireland: 25% (Andrew Kelley)
So the results come out close to what we would expect.
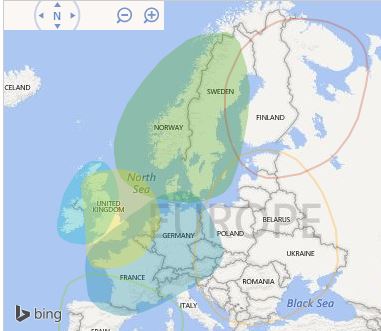
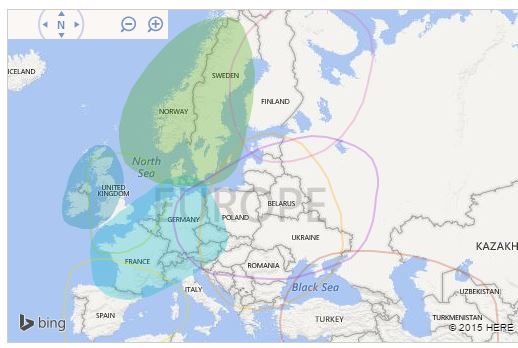
**I still like to say my “Ethnic Center” is in the middle of the North Sea!
My son and both Eric’s sons and one of Bruce’s daughters also have tested with ancestryDNA.
Here is my husband, Edmund’s results compared with my son, Sky’s:
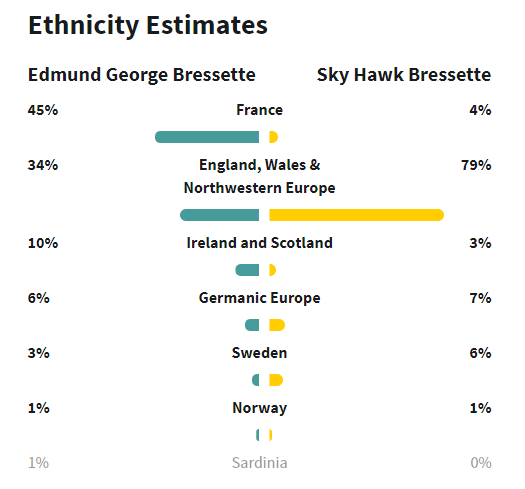
My husband’s father was all French Canadian, his maternal grandmother was all ethnic German/Alsatian. His maternal grandfather was adopted, but we know he was at least 1/4 Irish and probably at least 1/4 English on his mom’s side. The dad’s side, if I have identified him correctly, appears to go back to New England, so is likely mostly English.
If I compare what Sky’s actual results are with what would be (expected) from looking at his dad’s and mine, I get the following:
- England, Wales & Northwest Europe: 79% (45%)
- Germanic Europe: 7% (16%)
- Sweden: 6% (1.5%)
- France: 4% (22.5%)
- Ireland & Scotland: 3% (10.5%)
- Norway: 1% (4%)
- Sardinia: 0% (0.5%)
He appears to have inherited much more of the English than any of the other ethnicities. He didn’t get much of the French, German or Irish! (It does look like he got about 7% more DNA from his Grandma B than his Grandpa B, if I compare actual cM shared with his grandparents.
Here is are Eric’s son’s results compared with each other:
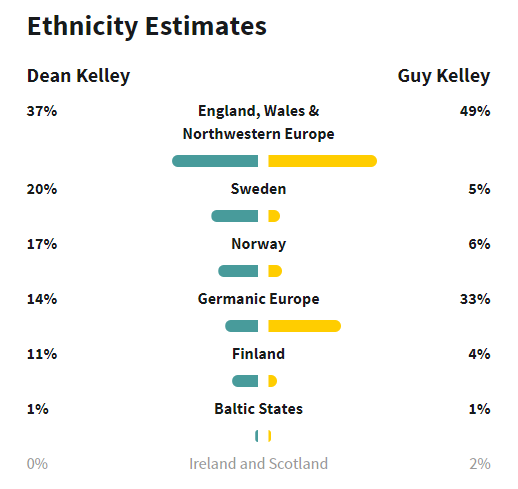
If I average their results and compare it with their dad, I come up with the following estimate for their mom, compare it with her (sister), who has also tested with ancestryDNA ~then average the 2:
- England, Wales, Northwestern Europe: 39% (21%)~30%
- Sweden: 21% (19%)~20%
- Norway: 10% (35%)~22.5%
- German: 16% (0%)~16%
- Finland: 14% (18%)~16%
- Baltic: 2% (0%)~1%
- Ireland & Scotland 0% (7%)~2%
According to her tree her grandparent’s ethnicities are as follows:
- One goes way back in the U.S, and has English, Welsh, and French, at least, which probably accounts for most of the English, Welsh, Etc.
- One had Swedish grandparents, so we would expect ~25% Swedish.
- One had parents that went back to Galicia, which was part of the Austrian Empire, but is now part of Western Ukraine.—This is the one that is most puzzling. You would expect something from Eastern Europe, but maybe that is where she gets most of her German.
- One had Norwegian parents, so we would expect ~25% Norwegian.
Bruce’s Daughter, Rose:
Here is a comparison of Bruce and his daughter, Rose:
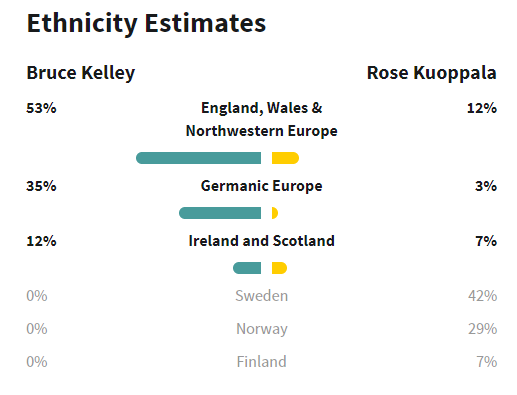
Rose’s mother was born in Sweden, so we should expect a large amount of Swedish and other Scandinavian. The math does not work out very well if I try to come up with an estimate for her mother, but if I throw out the negative numbers for England (-29%) & German (-29%) and spread the rest out proportionally, I get:
- Sweden: 53%
- Norwegian: 37%
- Finnish: 9%
- Ireland & Scotland: 1% (Maybe those Vikings brought back some Celtic brides.)
It is important to note that although Bruce did not show any Norwegian, Swedish, or Finnish, Eric and I did. So he could still have had some trace amounts that could show up in his daughter and maybe could have had an additive effect in combination with her mother’s DNA?
The following chart shows the amount of DNA we share with each other, at least according to what was tested by Ancestry. The charts below show what would be expected probabilities for each relationship.
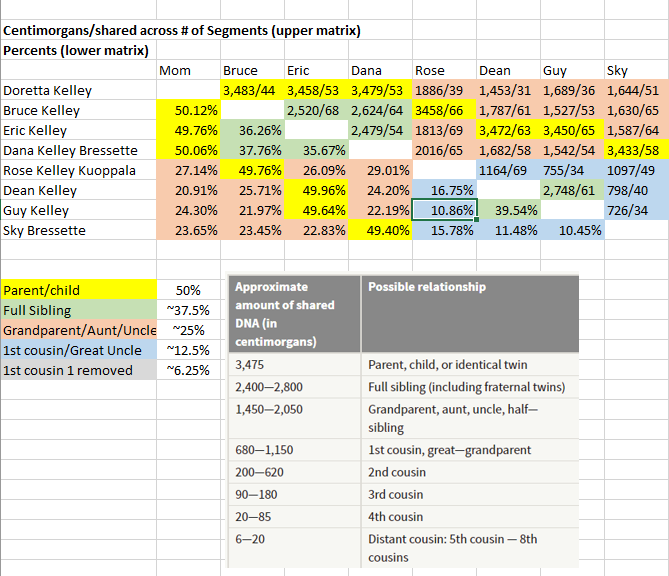
Rose seems to be the biggest outlier here. She and I share about 4% more DNA than would be expected. She also shares 3-4+% more with Dean and Sky than would be expected, and about 2% more than what would be expected with her grandmother. Dean shares about 4% less with his grandmother than would be expected, but 2% more with his brother than would be expected. Bruce shares ~3% less with Guy than would be expected and Eric shares ~2% less with Sky than would be expected.
What seems most interesting here is that many people have remarked how alike Rose and I are in looks and personality!
Old Analyses:
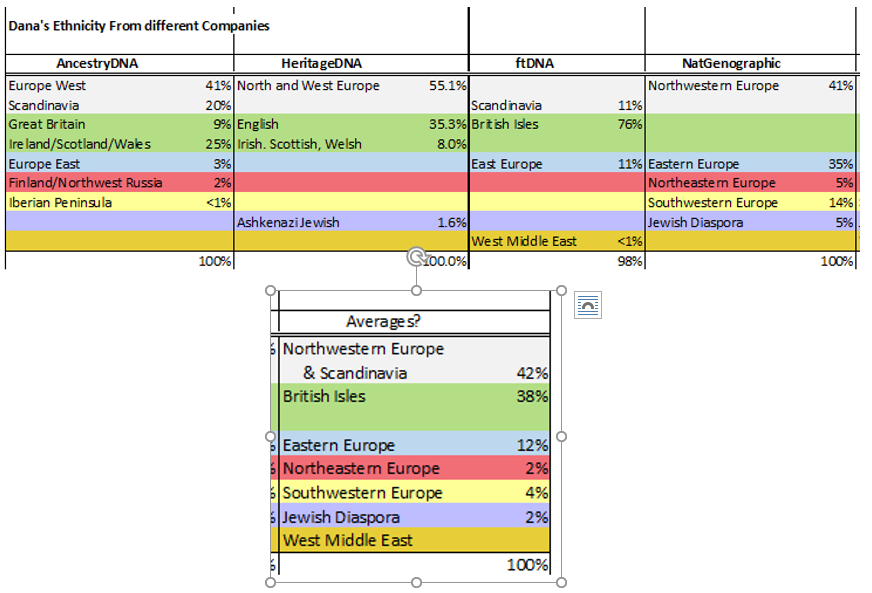
I have now gotten ethnicity reports from 4 different companies. The results are “all over the map,” so to speak, which indicates that this is not an exact science! I am still mostly North and Western European, although the most recent results show a lot more Eastern European and a bit more Southwestern (Iberian) European. I don’t know if it makes sense to average them..but I did..
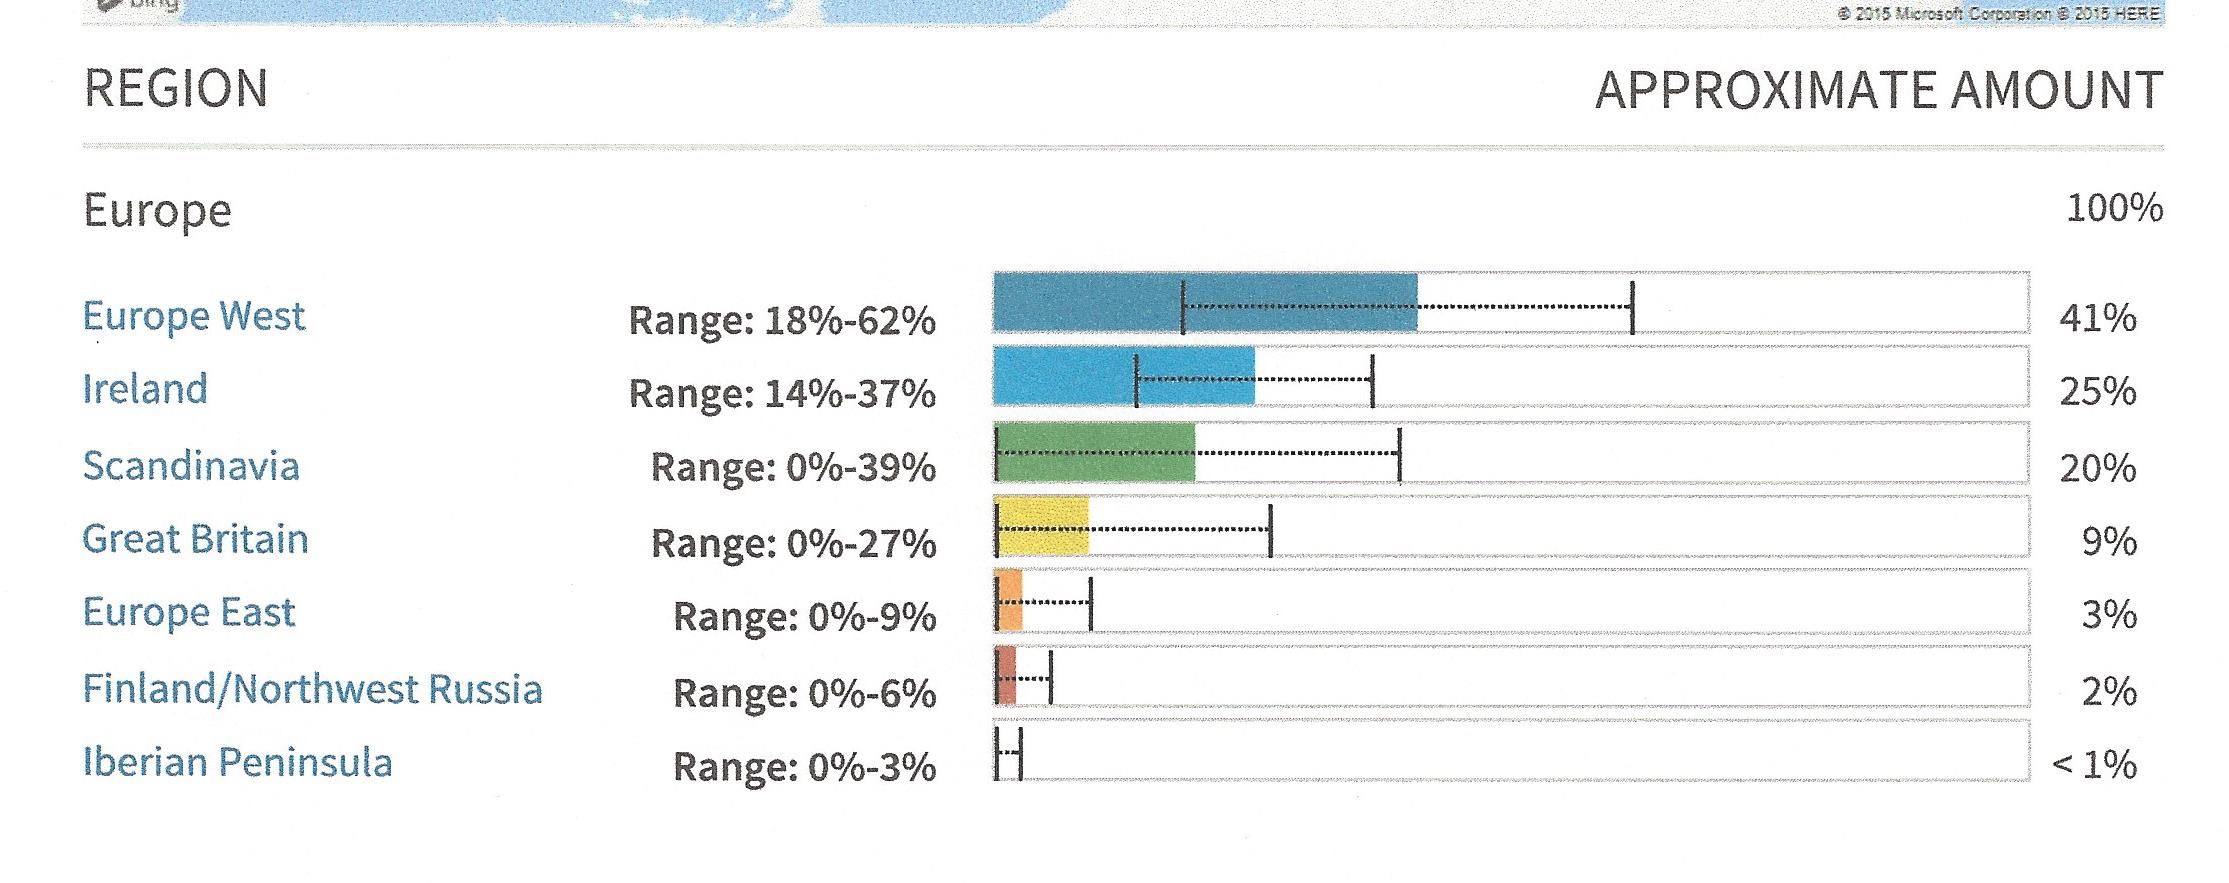
When I had my brother, Eric tested. His ethnicity came up very different from my mom and I.
We get 50% of our nuclear DNA from each of our parents. But because of how chromosomes recombine and divide during meiosis, the contribution that we get from our grandparents can vary, even though the PROBABILITY is 25%. Therefore, each generation of more distant ancestors may contribute varying amounts to our genome.
That said, these percentages from DNA results are only estimates, median values of a range of possibilities. The width of the range depends on how heterogeneous or homogeneous that ethnic group is.
It is important to note how they come up with these estimates. They compare our DNA to a sample group of individuals from each region. It sometimes becomes difficult to distinguish distinct ethnic groups, depending on how much interbreeding occurred between groups. Those living close to trade routes or coastlines subject to invasion are likely to be genetically diverse than those who were more isolated.
The most surprising result is Eric’s large amount of Great Britain and his small amount of Europe West and Irish.

Also found in: Ireland, France, Germany, Denmark, Belgium, Netherlands, Switzerland, Austria, Italy.
There may be several different explanations for this. It may be that our Irish Great grandfather, Andrew Kelley, had Scottish & British ancestry. His mother’s maiden name was McKettrick (Irish/Scottish, ‘son of Sitric’ from the Norse personal name Sigtryggr, for ‘true victory’ or conqueror.) His grandmother’s maiden name was Britt (an ethnic name for a Celtic-speaking Briton or a Breton).
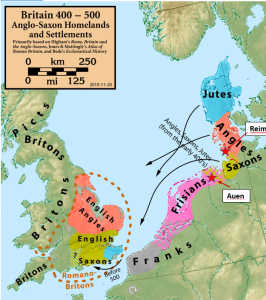
Dad’s German great-grandparents were all from the North Sea German provinces. His Grandpa & Grandma Reimers were from Schleswig-Holstein. His Grandma Kelley (Auen) was from East Friesland. This is where the Angles and Saxons that populated England originated.
But how could Eric get 78% Great Britain when mom only showed <1%? The only thing I can guess is that there must have been some kind of synergistic expression when combined with dad’s contribution. We know that much of Grandma’s C’s ancestry was British (probably about 3/4). On Grandpa C’s side, the Cliffords, at least, were British (He was probably about 1/4 British). So mom should have come up as about 30-50% Great Britain. (See more estimates based on our family tree further down on the page).
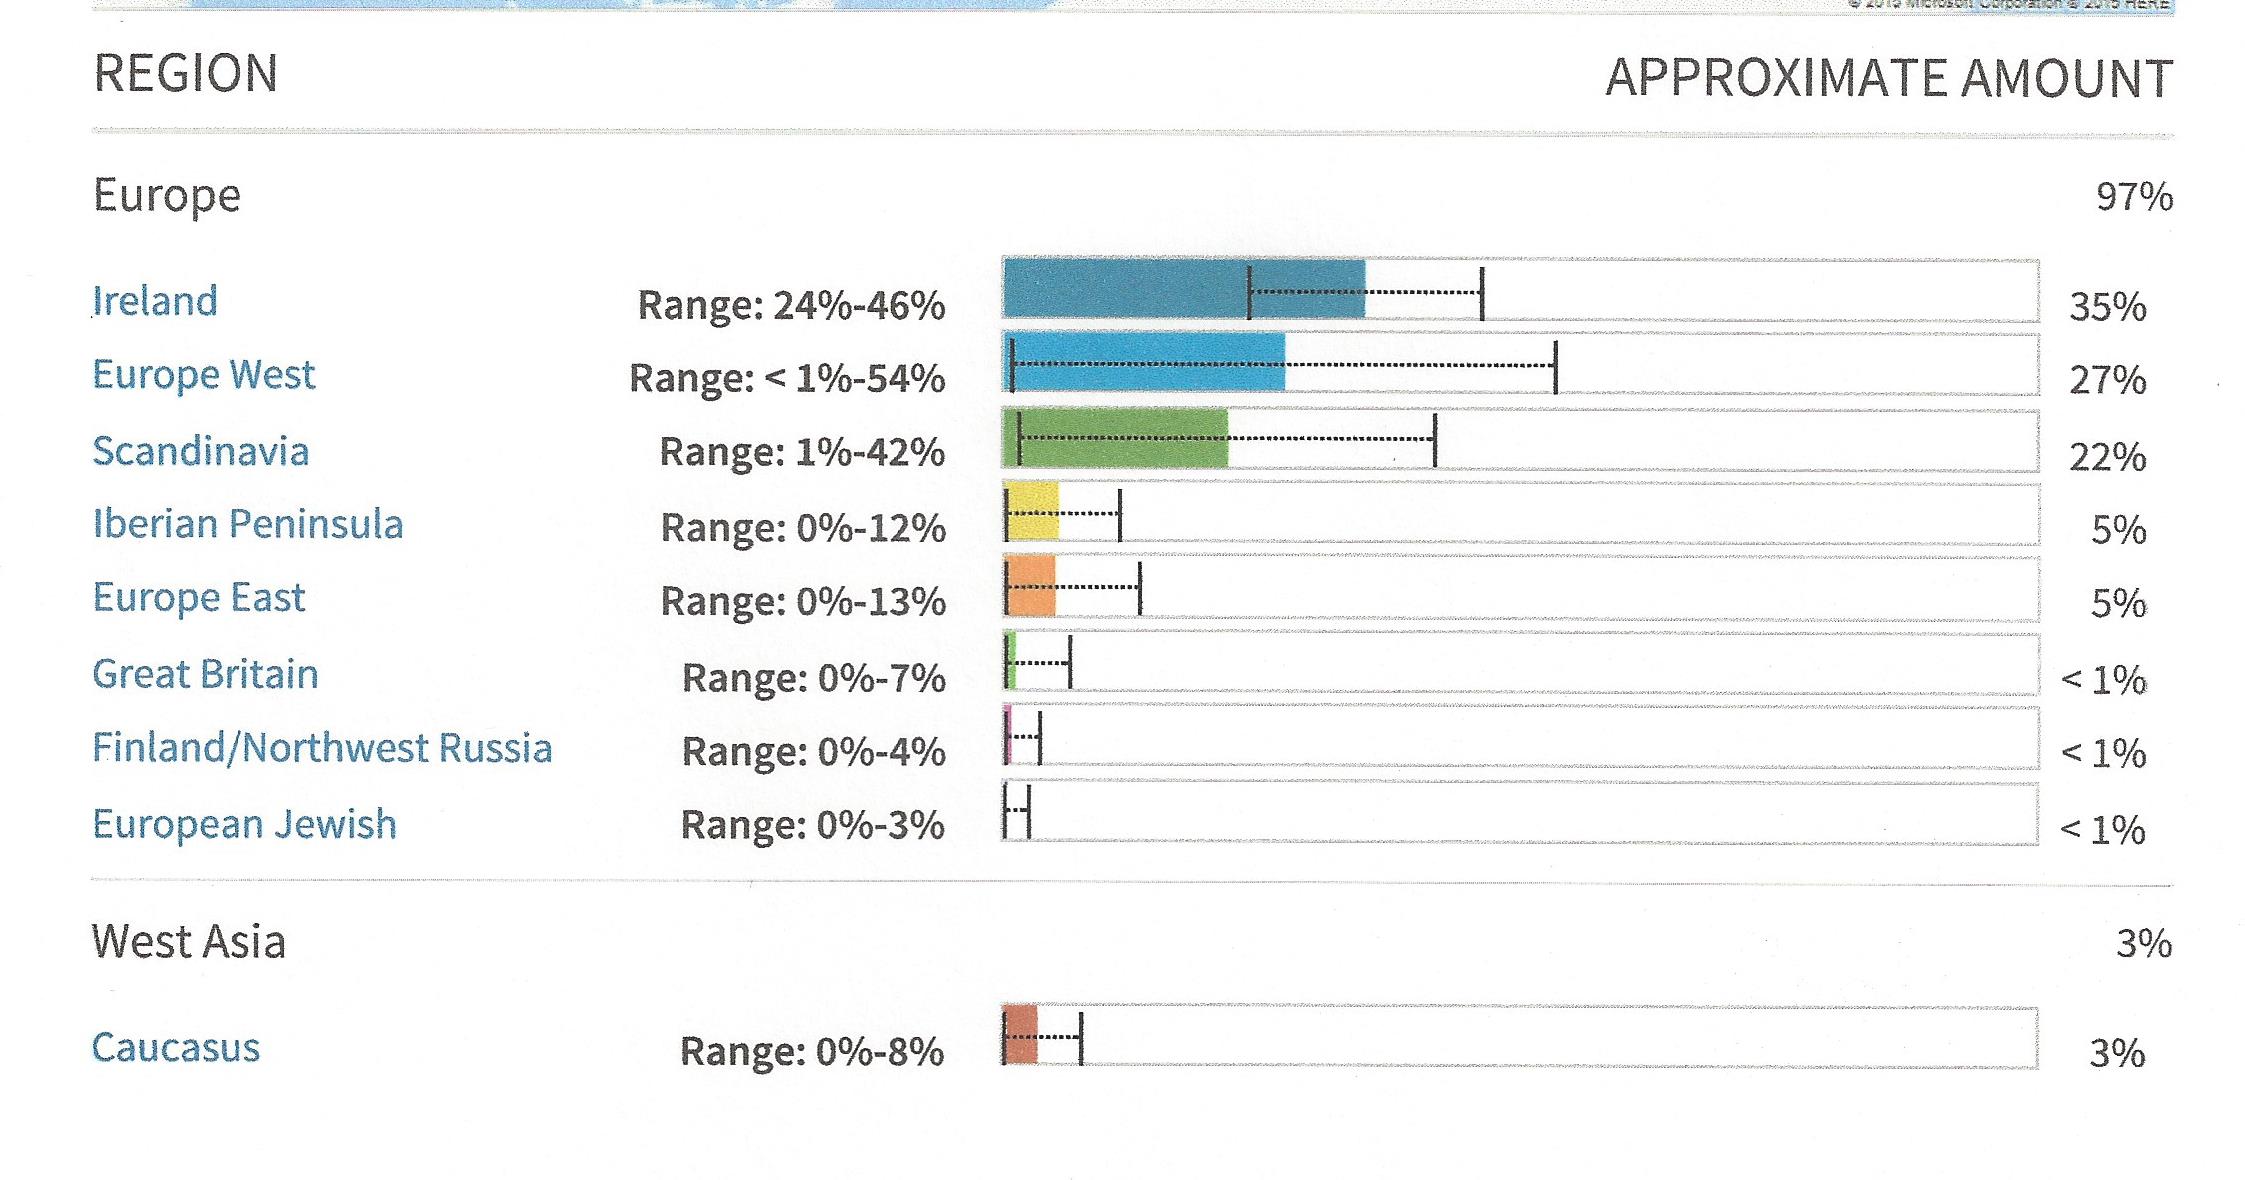
Mom said she was always told she was “Scotch, Irish & German.” As far as I have been able to determine. She only has about 9% Scotch, 13+% Irish, & 20% German. She actually SHOULD be “English, German, Irish, Dutch, Scottish.” based on our family tree.
So much of the comparison i did earlier is thrown out the window, especially the calculations I did to try and estimate Dad’s DNA ethnicity…
OLD:
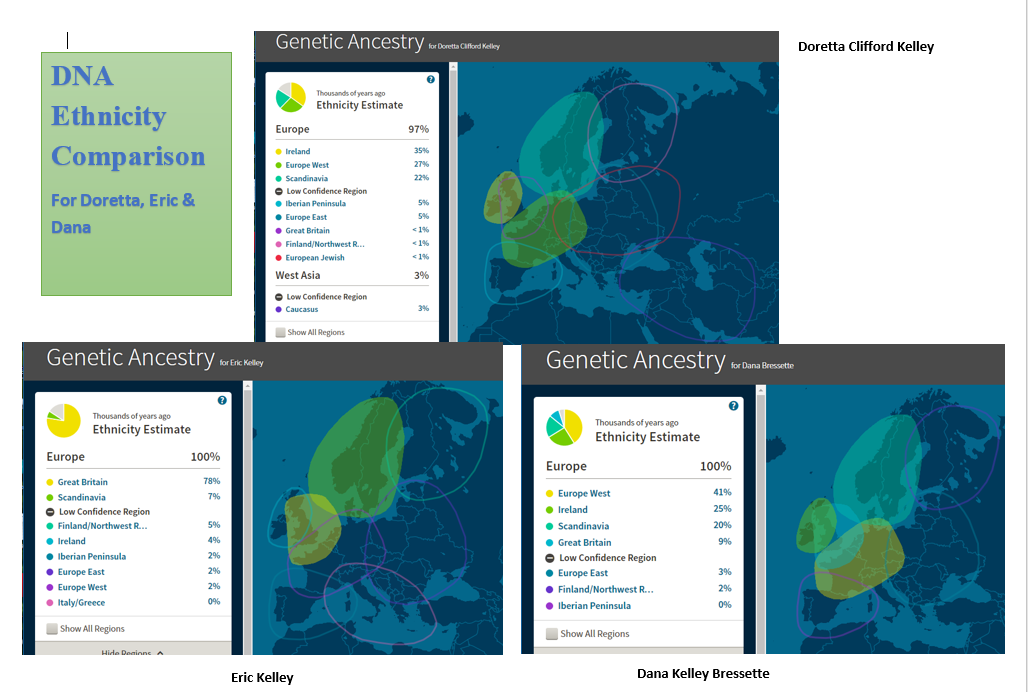
I have had DNA tests done for my mom and myself, and for Edmund and his mom. It is interesting to compare the ethnicity estimates with the actual places from where our ancestors immigrated.
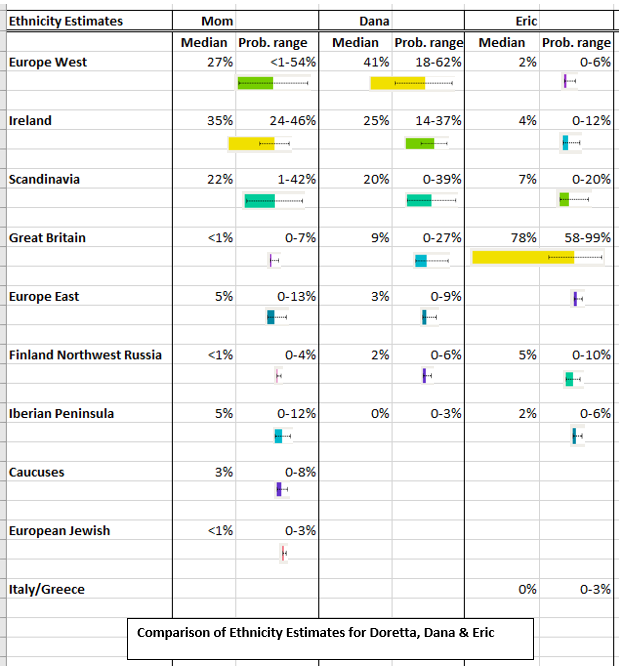
It is important to note that these are just estimates. AncestryDNA “creates estimates for… genetic ethnicity by comparing…DNA to the DNA of other people who are native to a region. The AncestryDNA reference panel (version 2.0) contains 3,000 DNA samples from people in 26 global regions.”
The charts give a percentage for each ethnicity. This is a median value. The actual percentage is likely to be somewhere within the lower and upper ranges given on the chart. Some regions, such as Ireland, are more homogeneous; they have less genetic variation. Whereas Europe West & Scandinavia are more heterogeneous, and have more genetic variation. This is certainly a factor of immigration, interbreeding, and history of invasions (including rape, captive slaves, political marriages, etc. hopefully only in the distant past!), among European populations.
Dana Kelley Bressette
Ethnicity Estimate
____________________________________
Doretta Clifford Kelley
Ethnicity Estimate
It seems odd that mom did not show more ethnicity from Great Britain, by my figuring she should have 40% (England & Scotland), but she only shows only 0-7% in her DNA analysis. But her Irish was higher; perhaps many of her English ancestors were actually Irish? By looking at the ethnicities of our DNA matches, it seems likely that her European Jewish comes from the German side.
AncestryDNA has also matched us with many distant cousins. I have communicated and shared information with several of them. Here are the numbers of distant cousins so far that we have established one or more confirmed shared ancestors:
- Cornett: ~137
- Verbryck: ~62
- Woodrum: ~45
- Clifford: ~22
The Cornetts, seem to have been especially prolific!
____________________________
By comparing my mom’s estimate and my estimate, I can calculate an estimate for my dad, Dean Kelley (I had to fudge the numbers a bit so they didn’t end up greater than 100%, the calculated numbers added up to 109%):
- Europe West: 50%
- Scandinavia: 17%
- Great Britain: 16%
- Ireland: 14%
- Finland/Northwest Russia: 3%
- Europe East: 1%
I was initially surprised that most of my 25% Irish came from my mom’s side. But considering that Andrew Kelley’s mother’s maiden name was McKettrick (Scottish) and his grandmother’s maiden name was Britt (British), the Great Britain estimate is not so surprising. And we all know the Scandinavian Vikings spread their genes all around Europe (as well as their captives). The Frisians were also a seafaring folk; they may be closely related to early settlers in Great Britain. (Frisian is somewhat similar to English).
My DNA cousin matches on my dad’s side only show a few confirmed shared ancestors (one Kelley, and a couple Auens). I think that it is mostly due to the fact they were more recent immigrants and they seem to have had a lower birth rate. It also depends on who becomes interested in genealogy and actually has a test done.
___________________________